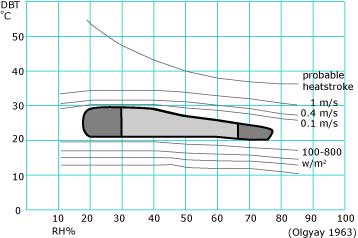
Victor Olgyay, a Hungarian architect who specialized in climate sensitive design, produced a bioclimatic chart graphing the human comfort zone (Olgyay, V., 1963, Design with climate, Princeton University Press, NJ). The variables he used are relative humidity and temperature. The center or average of the comfort zone was found using the chart at about 25°C and a relative humidity of 45%, corresponding to an Apparent Temperature of 26°C.
|

